Engineering Metrics: What Actually Matters in 2026
Every engineering leader eventually hits the same wall: you know something is slowing your team down, but you can't quite point to what it is. PRs sit in review for days. Deployments that used to take minutes now take hours. Incidents drag on because nobody can trace the root cause through a codebase that's grown far beyond any one person's understanding. Without data, these conversations turn into opinions, and opinions don't fix delivery problems.
Engineering metrics give you that data. They measure the things that actually matter about your delivery process: how frequently you deploy, how long code sits before it ships, how often changes break something, and how fast your team recovers when they do. Done well, these metrics illuminate bottlenecks and give your team a shared language for talking about performance. Done poorly, they create surveillance culture and perverse incentives.
The difference comes down to what you measure and how you use it. Track individual developer output, and you'll get commit inflation and rushed code reviews. Track vanity metrics like lines of code, and you'll optimize for the wrong outcomes entirely. But track the right things at the team level, and actually act on what you find, and metrics become one of the most powerful tools an engineering organization has.
This guide covers the metrics that matter most: DORA metrics, productivity indicators, and quality signals. You'll learn how to implement them without creating a toxic culture, how to avoid common traps, and how to turn measurement into meaningful improvement.
What Are Engineering Metrics?
At their core, engineering metrics are the numbers that tell you what's really happening in your development process, as opposed to what you think is happening. How often does code reach production? How long does a change wait between commit and deployment? What percentage of deploys cause problems? How quickly does the team recover from incidents? These are the kinds of questions metrics answer.
The most critical distinction is between activity metrics and outcome metrics. Activity metrics measure effort: hours logged, PRs submitted, meetings attended. Outcome metrics measure results: features delivered, bugs resolved, and time to restore a broken system. A developer who submits twenty PRs in a week might be thrashing across too many workstreams, while one who submits three thoughtful, well-tested PRs might be delivering far more value. Outcome metrics tell you what's actually moving the business forward.
Good metrics correlate with outcomes that matter: delivery speed, production reliability, developer satisfaction, and customer experience. They're actionable. When the number changes, you know what to investigate. And they don't create perverse incentives. If a metric can be gamed in ways that hurt the team, it's the wrong metric.
Why Engineering Metrics Matter
Without metrics, problems stay invisible until they become catastrophic. A deployment process that takes six hours doesn't announce itself. It just quietly erodes your delivery velocity. A code review bottleneck doesn't spike overnight; it worsens so gradually that the team stops noticing. These are the kinds of issues that metrics make undeniable.
Consider what happens when you put a number on a problem. A lead time chart showing that code takes 72 hours to reach production after commit is hard to ignore. A 35% change failure rate is a clear wake-up call. Suddenly, instead of vague complaints about "things feeling slow," your team has specific, concrete targets for improvement. You can say "our biggest bottleneck is code review wait time" instead of "we need to move faster."
The cultural impact is equally powerful. When teams see that leadership cares about "how long does code wait in review?" instead of "are you working enough hours?", it sends a clear signal: the delivery process matters, not how busy people look. This shapes how people work. In a world where codebases grow faster than ever (especially with AI-generated code accelerating volume), understanding your process through data is essential.
Key Categories of Engineering Metrics
Engineering metrics cluster into three broad categories, each revealing a different dimension of your team's performance.
DORA Metrics
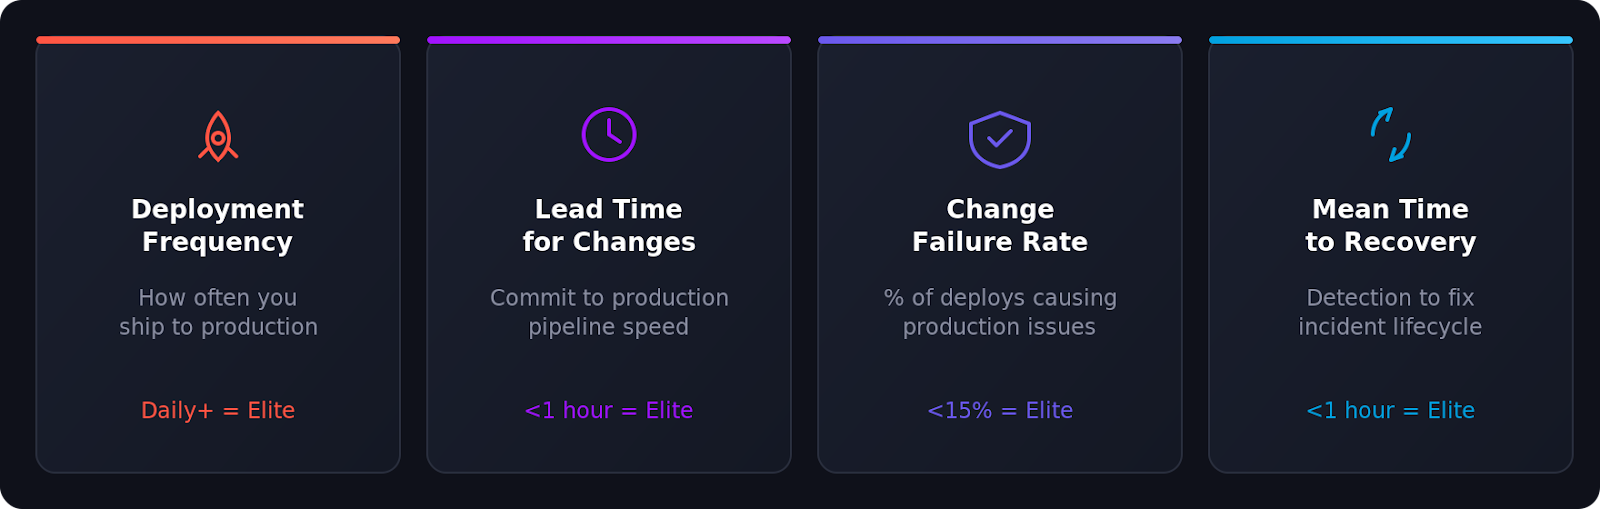
DORA (DevOps Research and Assessment) emerged from years of research tracking how engineering practices correlate with business outcomes. The researchers identified four metrics that consistently predict organizational success: deployment frequency, lead time for changes, change failure rate, and mean time to recovery. When they improve, delivery gets faster, code quality increases, and team morale follows. They're not perfect, but they're the closest thing to a north star the industry has.
Productivity Metrics
Productivity metrics show how much your team ships and where work gets stuck. How long from idea to production? How many features per sprint? Where do items sit idle? Keep these at the team level. Team productivity metrics reveal systemic issues. Individual productivity metrics, though, are almost always toxic. They incentivize rushed work, corner-cutting, and the short-term thinking that creates long-term debt.
Quality Metrics
Quality metrics show how well your code works once it reaches users. Code coverage trends, production bug rates, vulnerability counts, and system uptime. They're leading indicators. Declining test coverage often precedes production incidents. Rising unpatched vulnerabilities often precede security breaches. Tracking quality metrics alongside velocity metrics ensures your team isn't trading speed for reliability.
The Most Important Engineering Metrics to Track
If you're starting from scratch, these are the metrics that matter most for understanding how your team ships software.
Deployment Frequency
How often does your team deploy to production? Some deploy fifty times a day, others monthly. The trend matters more than the absolute number. Frequent deployments keep each change small and easy to debug. They force investment in automated testing and deployment infrastructure. They get fixes and features to customers faster. And developers see their work in production regularly, not after months of waiting.
Low deployment frequency points to specific, fixable problems: manual testing gates, weak CI/CD automation, or too many approval ceremonies. These are process issues, not talent issues.
Lead Time for Changes
Lead time measures the full journey from commit to production. That includes code review, automated testing, deployment queues, and the deployment itself. Google's research shows elite teams achieve lead times in hours, while most teams take days or weeks.
Lead time captures the entire pipeline. A 72-hour lead time could come from 48 hours of code review wait time, slow test suites, or manual deployment gates. The metric tells you something is wrong. Breaking it down tells you exactly where. Often the problem isn't where you'd expect, which is why measuring matters.
Cycle Time
Cycle time starts before commit: when a developer begins the task, including understanding the problem, exploring the codebase, and writing code. This broader view reveals different friction. Long cycle times often signal poorly scoped features, unclear requirements, or context-switching that kills focused work.
Breaking cycle time into phases: implementation time, code review time, and deployment wait time. Each problem requires a different fix, and you can't prioritize without the breakdown.
Change Failure Rate
Change failure rate is the percentage of deployments that cause problems: degradations, bugs, rollbacks, anything that hurts users. It counterbalances velocity metrics. You could deploy every five minutes if quality didn't matter. Change failure rate keeps you honest.
High failure rates point to inadequate testing, reviews that miss issues, or architectures in which a single bad change cascades across services. Teams below 5% have strong automated testing, thorough reviews, and isolated systems.
Mean Time to Recovery (MTTR)
MTTR measures how quickly your team resolves a production incident from detection to fix deployment. It acknowledges a pragmatic truth: things break. What matters is recovery speed.
Fast MTTR needs three things: monitoring and alerting that catch issues fast, runbooks and documentation that speed diagnosis, and deployment automation that lets you fix with confidence. Teams with these recover in minutes, not hours. That makes frequent deployment safer. When you know you can fix a problem quickly, you ship with confidence.
Codebase visibility matters too. When an incident fires, the first question is "what changed and what does it affect?" In large, complex codebases spanning multiple repositories, answering that fast is the difference between a five-minute fix and hours of investigation. Sourcegraph Code Search lets incident responders trace changes across repositories, understand dependencies, and identify problem blast radius without relying on code authors. That visibility directly compresses MTTR.
How to Implement Engineering Metrics
Starting to track metrics isn't technically hard. Doing it in a way that actually drives improvement requires thoughtful consideration of what you measure, how you communicate it, and what you do with the data.
Choosing the Right Metrics for Your Team
Identify your most obvious pain point first. Is deployment slow and risky? Are bugs escaping code review? Are customers waiting for fixes? Your problems should dictate what you measure, not a one-size-fits-all framework.
If you're new to metrics, DORA is a strong starting point. Four metrics, well-understood and validated across hundreds of organizations. You get a baseline of delivery performance, then layer in specialized metrics once you understand fundamentals.
Be transparent about why you're measuring. Tell your team which metrics you're tracking and why. Make clear that metrics exist to understand systems, not evaluate people. Teams that understand this engage with metrics instead of gaming them.
Resist the urge to track everything. Start with one or two metrics, get comfortable interpreting them, and add more as your measurement practice matures. Twenty metrics create noise; one well-understood metric drives action.
Tools for Tracking Engineering Metrics
Your existing tools contain most of the data you need. CI/CD knows deployment frequency and lead time. Incident management knows MTTR. Git history shows code review patterns and commit cadences. The real challenge isn't data availability, it's aggregation and interpretation.
Dedicated platforms like Dora, Velocity, and LinearB pull data from your existing tools and create unified dashboards. They're helpful for teams that want automated tracking without building their own reporting pipeline.
For a deeper understanding, Sourcegraph Code Search provides different visibility. When metrics show slow code review, code search helps investigate underlying causes. Developers and reviewers can trace changes across repositories, understand unfamiliar code faster, and navigate dependencies that slow progress. Sourcegraph's Deep Search uses AI to answer complex questions like "which services depend on this deprecated API?" or "how is authentication handled across our microservices?" This context turns abstract metric trends into specific, actionable insights.
Whatever tools you choose, consistency beats sophistication. Set up automated reports weekly or biweekly, include trends, and share widely. Don't hide metrics in a management dashboard. Team visibility makes metrics motivating, not threatening.
Common Pitfalls When Measuring Engineering Performance
Good intentions with bad execution can damage teams. These are the traps that catch most organizations.
Measuring individuals instead of teams. Developer-level metrics create perverse incentives immediately. People rush reviews, inflate commits, and cut corners. Always aggregate to the team level. Team performance is what matters, and process changes improve it.
Optimizing for the metric instead of the outcome. Deployment frequency matters because it enables faster feedback and smaller, less risky changes. If a team deploys constantly without caring about safety, they've missed the point. Pair deployment frequency with change failure rate. Together, they tell the full story.
Tracking metrics and ignoring them. A 40% change failure rate is a signal that something is broken. Every metric needs an owner, and every significant trend triggers an investigation. "Our lead time increased 50% this quarter." demands "why?" and "what now?", not silence.
Ignoring context. Metrics without context mislead. A major incident spikes MTTR. Q4 financial close tanks velocity. Holiday weeks crater deployment frequency. These are expected variance, not team failure. Context matters when interpreting metrics.
Creating surveillance culture. If developers feel watched, they'll game metrics or leave. Frame metrics as diagnostic tools, involve engineers in choosing what to measure, and be transparent about data use. Teams get the most value when engineers actively review and act on metrics.
Vanity metrics. Lines of code, commits per day, hours in the office. Measurable but meaningless. They don't predict speed, quality, or customer satisfaction. Avoid them.
From Metrics to Meaningful Change
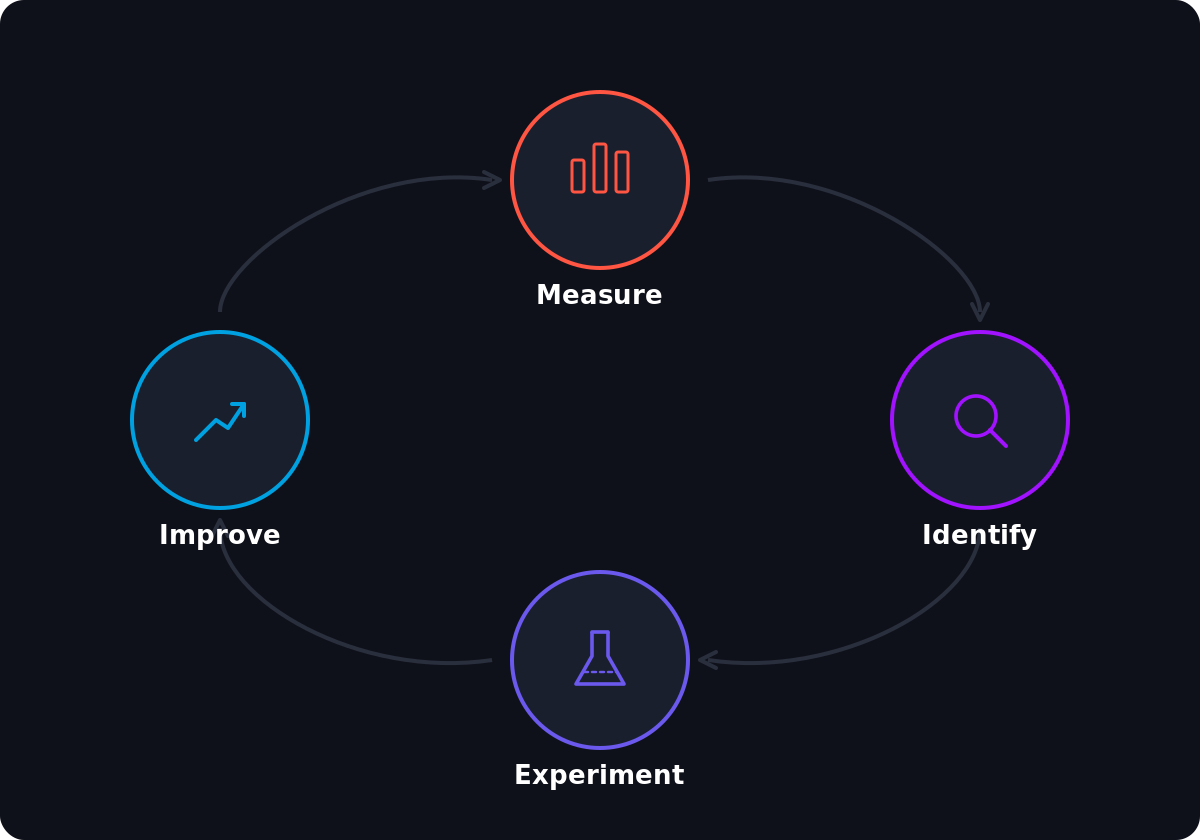
Measuring alone doesn't improve anything. Real work starts when you dig into data, identify problems, and run focused experiments.
Your lead time is 72 hours. That number isn't useful until you know where those hours go. Is the code stuck in review for 48 hours because reviewers lack context? Is the test suite taking two hours because it was never parallelized? Is there a manual deployment gate adding a full day? Different problems need different solutions, and breakdown is what makes metrics actionable.
Code review delays often stem from reviewers lacking context. They're unsure what a change affects, so they ask questions and request clarifications that extend the process for days. Code intelligence tools help here. When reviewers see how changes ripple through the codebase, trace dependencies across repositories, and understand blast radius, reviews move faster. Palo Alto Networks reported a 40% productivity boost for its 2,000-person engineering team after adopting cross-repository visibility.
Once you've identified the problem, run a focused experiment. Slow code review? Try clearer guidelines, designated reviewers, or smaller PRs. Slow tests? Try parallelization or smarter selection. Manual deployment? Automate it. Change one thing, measure impact, iterate. This loop (measure, hypothesize, experiment, measure) is how elite teams improve.
At scale, when metrics reveal you need to migrate a deprecated library across hundreds of repos or update a security pattern codebase-wide, Sourcegraph Batch Changes automates large-scale changes with one declarative file instead of manual updates. Workiva's engineering team reduced the time for this kind of change by 80%.
Review metrics weekly or biweekly. Look for trends, not individual weeks. One bad week is noise; a consistent downtrend warrants investigation. When your team cuts lead time from 72 hours to 36 hours, celebrate it. That's concrete proof that effort matters, far more motivating than abstract improvements.
Conclusion
Engineering metrics aren't about control, they're about clarity. In growing organizations where codebases sprawl across hundreds of repositories and teams ship code faster than ever, performance conversations are just opinions without data. Metrics give teams a shared language for identifying what works, what's broken, and where to focus.
DORA metrics predict delivery performance: deployment frequency, lead time for changes, change failure rate, and mean time to recovery. Combined with quality indicators and productivity signals, they show engineering health.
Metrics only create value if you act on them. Measure, understand, investigate, experiment, learn, and repeat. Teams get the most from data when they pair it with the right tools (visibility into delivery alongside deep codebase understanding), so when a metric signals a problem, they can solve it.
Start simple. If you measure nothing today, start with DORA. If you're already measuring, check whether your metrics connect to business outcomes and whether you're acting on them. Cut vanity metrics, add outcome metrics, review regularly, and invest in tools that turn numbers into actionable understanding. That's where metrics matter.
Ready to see what's behind your engineering metrics? Try Sourcegraph Code Search on your own code to explore how your team navigates and understands your codebase, or schedule a demo to see how it works at enterprise scale.
.avif)
